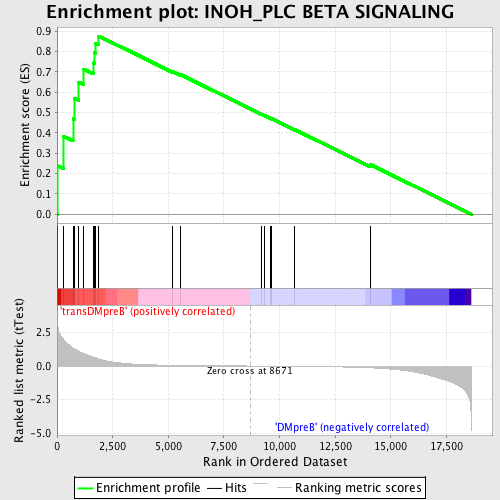
Profile of the Running ES Score & Positions of GeneSet Members on the Rank Ordered List
| Dataset | Set_04_transDMpreB_versus_DMpreB.phenotype_transDMpreB_versus_DMpreB.cls #transDMpreB_versus_DMpreB.phenotype_transDMpreB_versus_DMpreB.cls #transDMpreB_versus_DMpreB_repos |
| Phenotype | phenotype_transDMpreB_versus_DMpreB.cls#transDMpreB_versus_DMpreB_repos |
| Upregulated in class | transDMpreB |
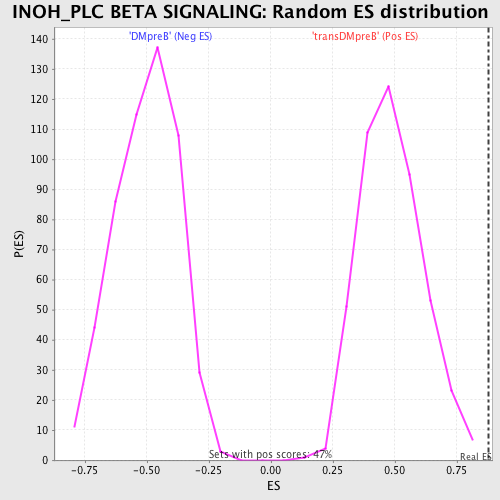
| GeneSet | INOH_PLC BETA SIGNALING |
| Enrichment Score (ES) | 0.8756108 |
| Normalized Enrichment Score (NES) | 1.8025677 |
| Nominal p-value | 0.0 |
| FDR q-value | 0.057810213 |
| FWER p-Value | 0.043 |
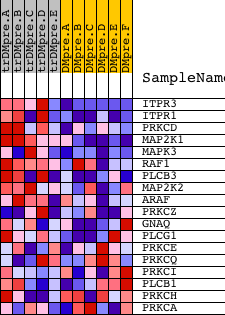
| PROBE | DESCRIPTION (from dataset) | GENE SYMBOL | GENE_TITLE | RANK IN GENE LIST | RANK METRIC SCORE | RUNNING ES | CORE ENRICHMENT | |
|---|---|---|---|---|---|---|---|---|
| 1 | ITPR3 | 9195 | 31 | 2.936 | 0.2373 | Yes | ||
| 2 | ITPR1 | 17341 | 285 | 1.959 | 0.3831 | Yes | ||
| 3 | PRKCD | 21897 | 716 | 1.338 | 0.4689 | Yes | ||
| 4 | MAP2K1 | 19082 | 767 | 1.285 | 0.5708 | Yes | ||
| 5 | MAPK3 | 6458 11170 | 961 | 1.090 | 0.6491 | Yes | ||
| 6 | RAF1 | 17035 | 1186 | 0.942 | 0.7138 | Yes | ||
| 7 | PLCB3 | 23799 | 1635 | 0.661 | 0.7435 | Yes | ||
| 8 | MAP2K2 | 19933 | 1669 | 0.648 | 0.7945 | Yes | ||
| 9 | ARAF | 24367 | 1729 | 0.613 | 0.8412 | Yes | ||
| 10 | PRKCZ | 5260 | 1877 | 0.520 | 0.8756 | Yes | ||
| 11 | GNAQ | 4786 23909 3685 | 5182 | 0.054 | 0.7023 | No | ||
| 12 | PLCG1 | 14753 | 5539 | 0.045 | 0.6869 | No | ||
| 13 | PRKCE | 9575 | 9170 | -0.006 | 0.4922 | No | ||
| 14 | PRKCQ | 2873 2831 | 9311 | -0.008 | 0.4853 | No | ||
| 15 | PRKCI | 9576 | 9605 | -0.012 | 0.4705 | No | ||
| 16 | PLCB1 | 14832 2821 | 9656 | -0.012 | 0.4688 | No | ||
| 17 | PRKCH | 21246 | 10685 | -0.026 | 0.4157 | No | ||
| 18 | PRKCA | 20174 | 14071 | -0.131 | 0.2444 | No |